Fragmented Hospital Operations
Hospital administrators often rely on multiple systems to monitor operational metrics such as patient admissions, waiting times and department capacity.
Core Challenges
- Fragmented Information: Multiple systems make it difficult to get a unified view of operations
- Delayed Detection: Operational bottlenecks identified too late to prevent critical situations
- Inefficient Resource Allocation: Important decisions may be delayed and hospital resources may not be allocated efficiently
- Complex Monitoring: Difficulty tracking patient flow, waiting times and department capacity simultaneously
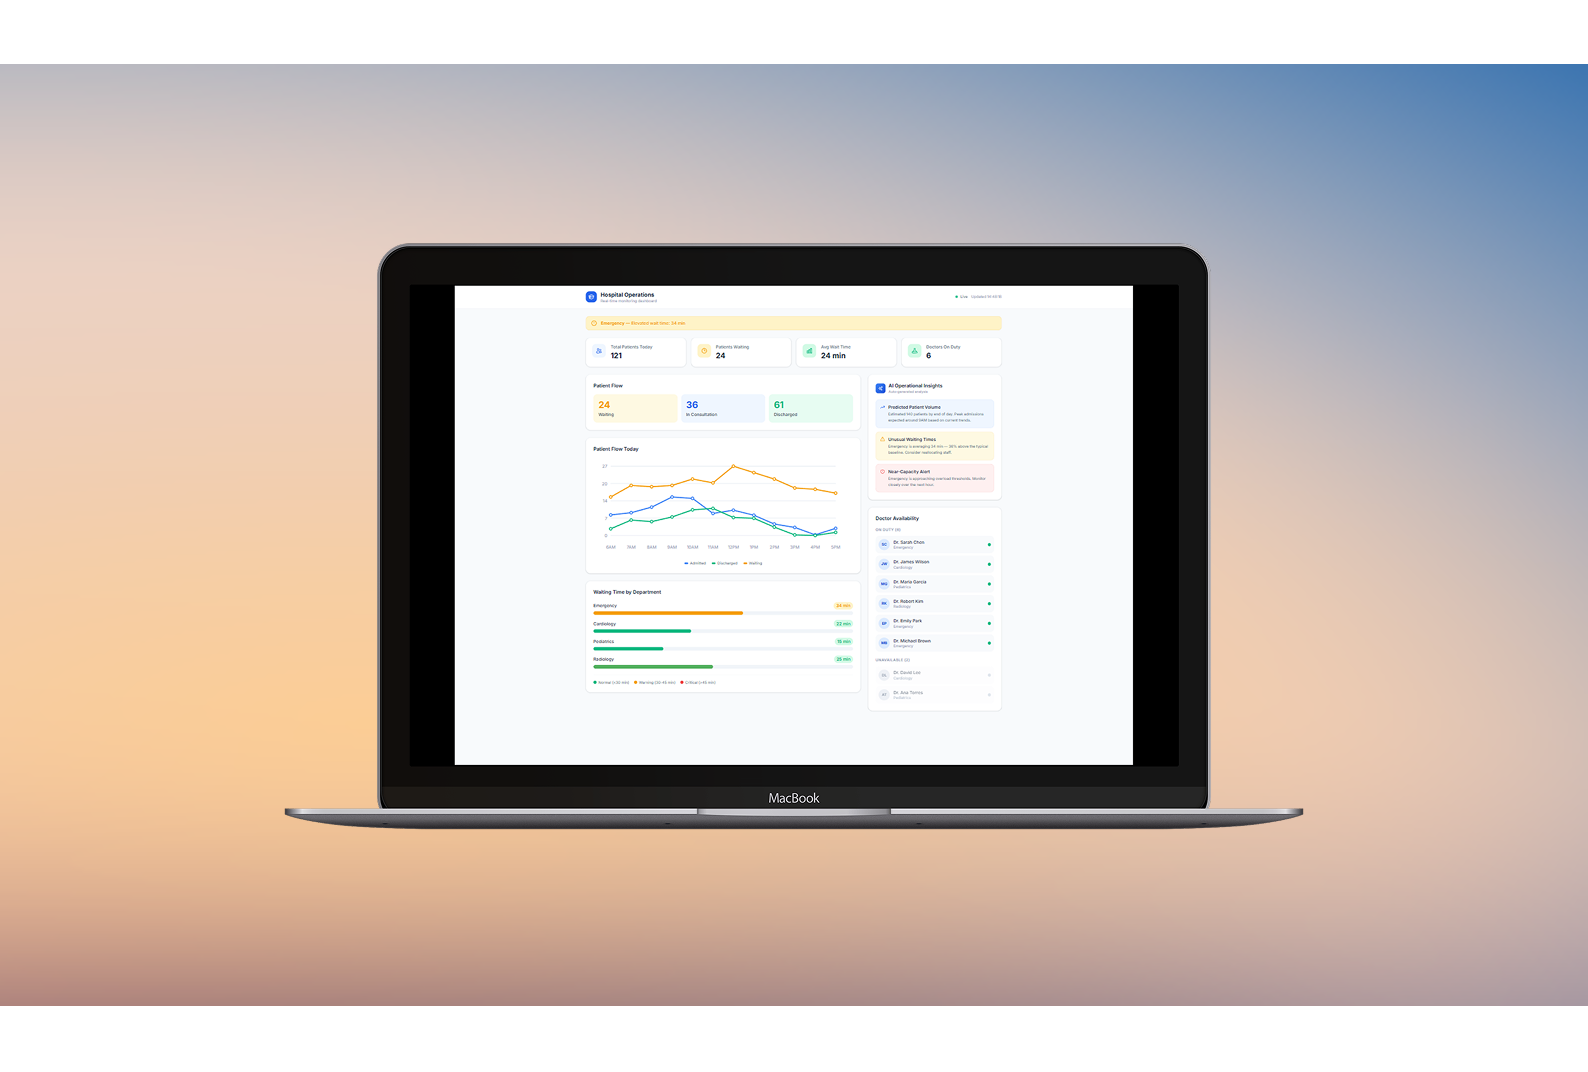
Real-Time Operational Intelligence
Design a real-time healthcare operations dashboard that allows administrators to monitor patient flow across departments, detect anomalies in waiting times, identify overloaded departments, and support faster operational decision-making.
Key Objectives
Monitor Patient Flow
Track patient movement across all hospital departments in real time
Detect Anomalies
Identify unusual patterns in waiting times and operational metrics
Identify Overload
Quickly spot departments approaching or exceeding capacity limits
Faster Decisions
Transform complex operational data into clear, actionable insights
Operational Clarity and Quick Decision-Making
The dashboard focuses on operational clarity and quick decision-making. To achieve this, the interface prioritizes the most relevant metrics for hospital operations, including patient flow, department waiting times and staff availability.
Design Principles
Clear Information Hierarchy
Most critical metrics displayed prominently with supporting details easily accessible
Real-Time Operational Indicators
Live data updates showing current status across all departments
Visual Alerts for Critical Situations
Color-coded indicators and notifications for immediate attention
AI-Generated Insights
Intelligent alerts highlighting anomalies and operational patterns
This approach reduces cognitive load and allows administrators to quickly understand the current situation.
Key Features
The dashboard integrates four essential features to provide comprehensive operational oversight.
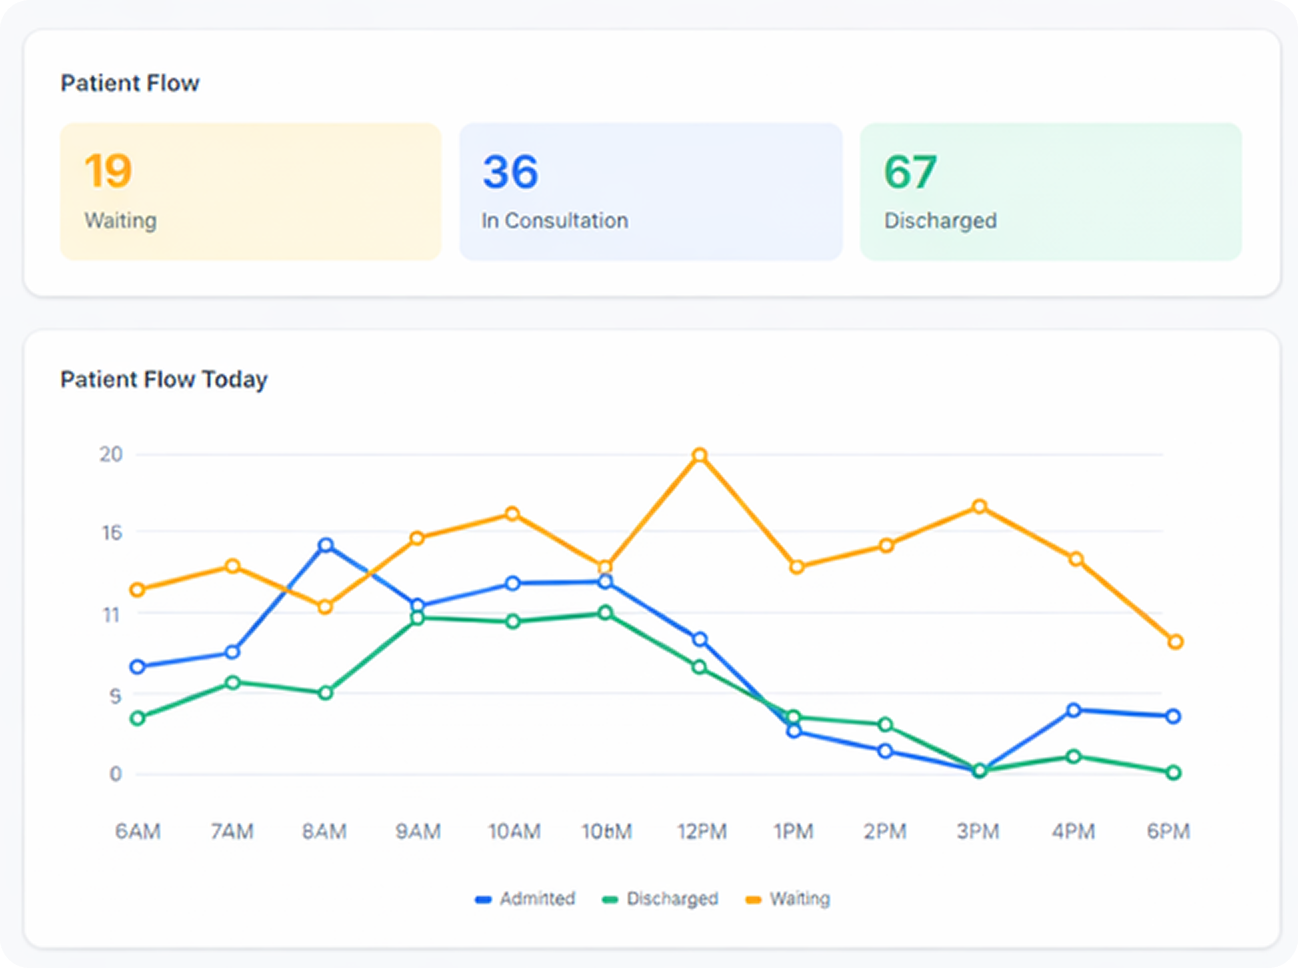
Real-Time Patient Flow
The dashboard visualizes patient movement through the hospital system, including admitted, waiting and discharged patients. This allows administrators to quickly detect unusual patterns in patient volume.
Capabilities:
- Live patient count per department
- Patient journey visualization
- Admission and discharge tracking
- Unusual pattern detection
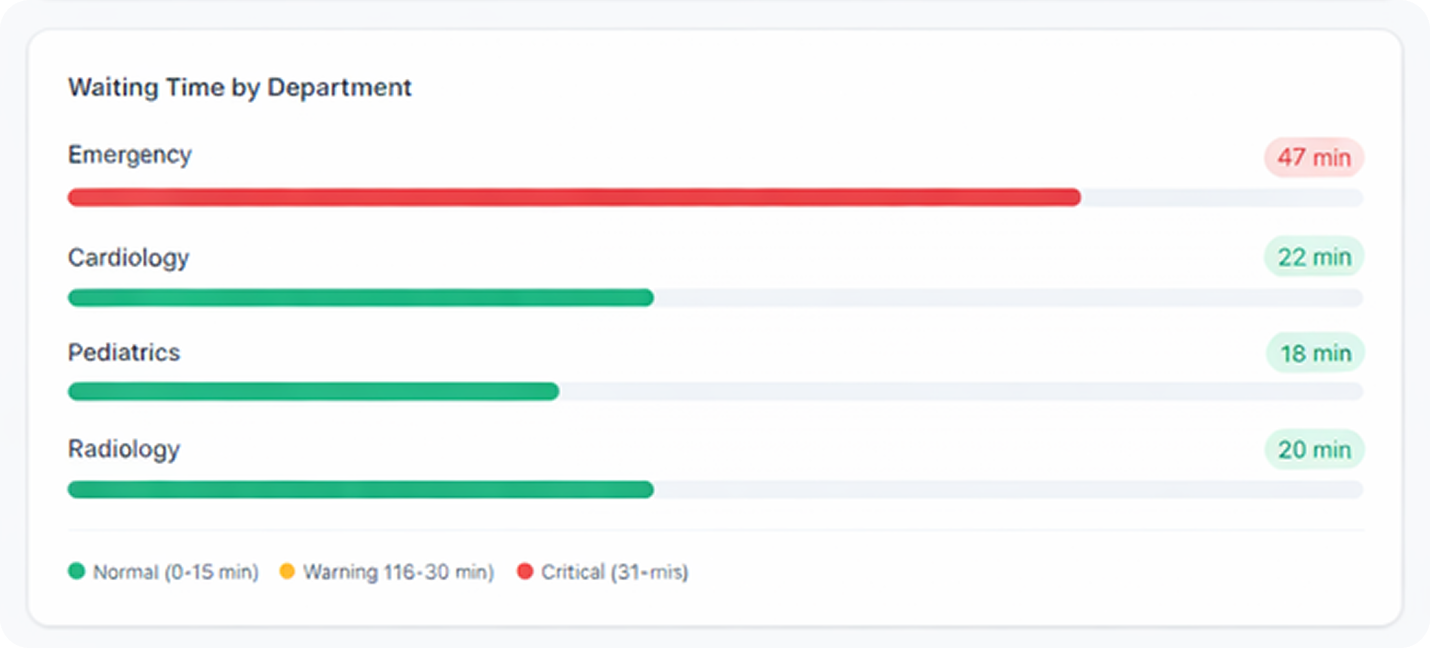
Department Waiting Time Monitoring
A dedicated section highlights waiting times across hospital departments. Color indicators and alerts help identify when waiting times exceed operational thresholds.
Capabilities:
- Average wait time per department
- Color-coded threshold alerts
- Historical trend comparison
- Peak hour identification
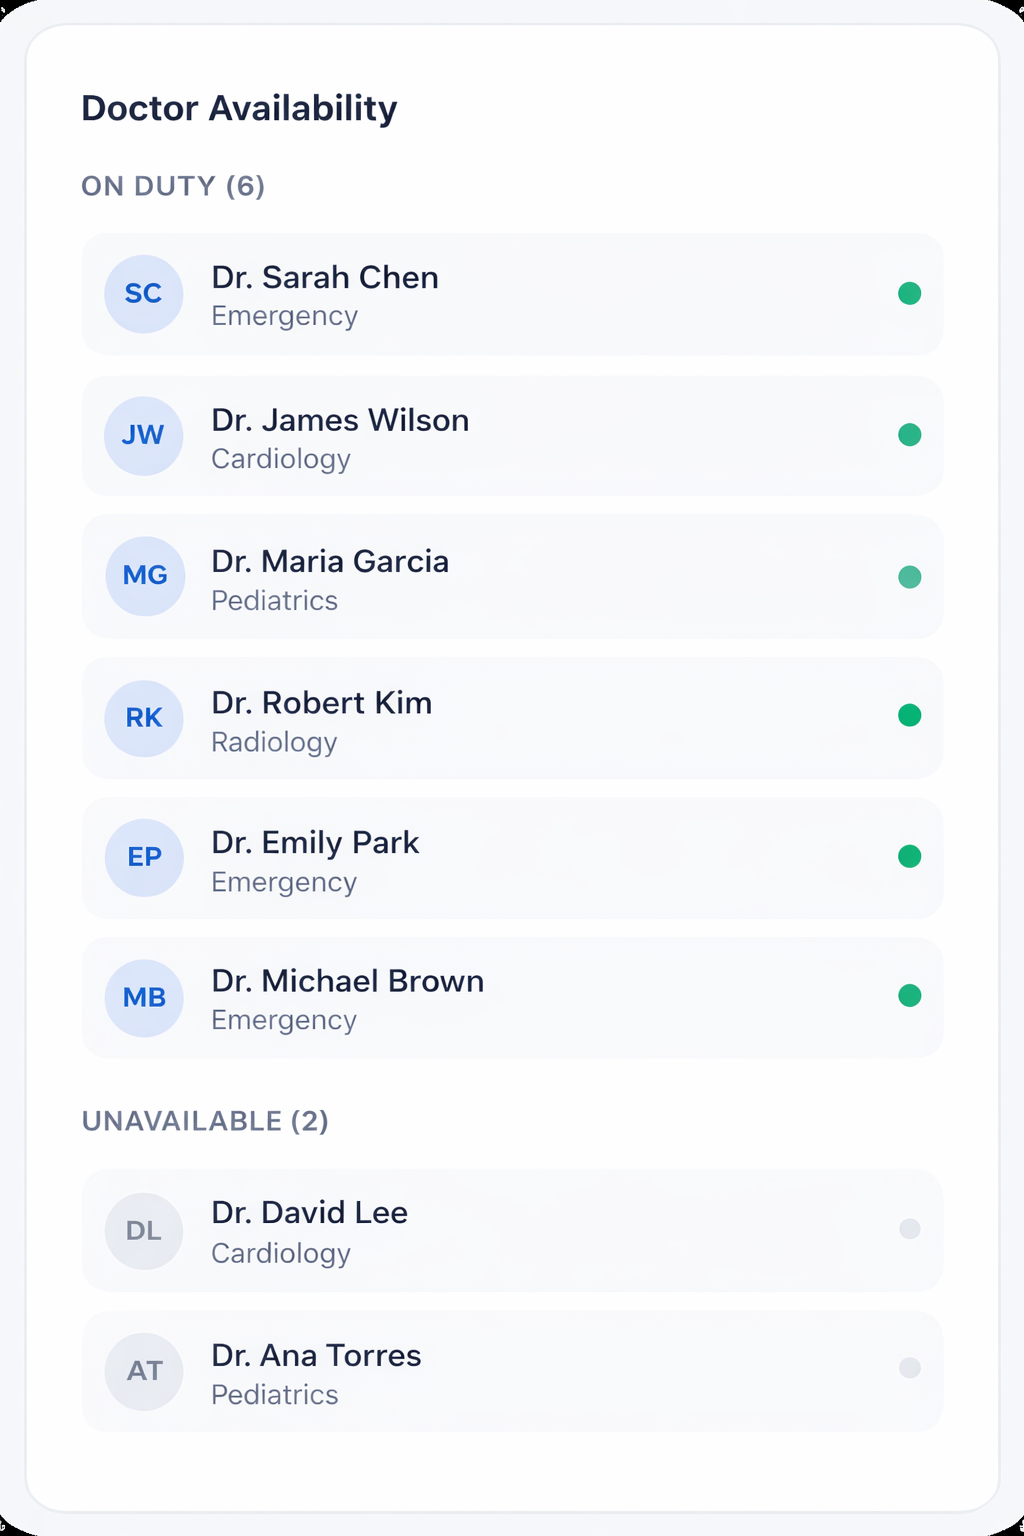
Doctor Availability
The dashboard also provides visibility into staff availability, helping administrators understand whether departments have sufficient medical staff.
Capabilities:
- Live staff status tracking
- Department staffing levels
- Shift schedule integration
- Understaffing alerts
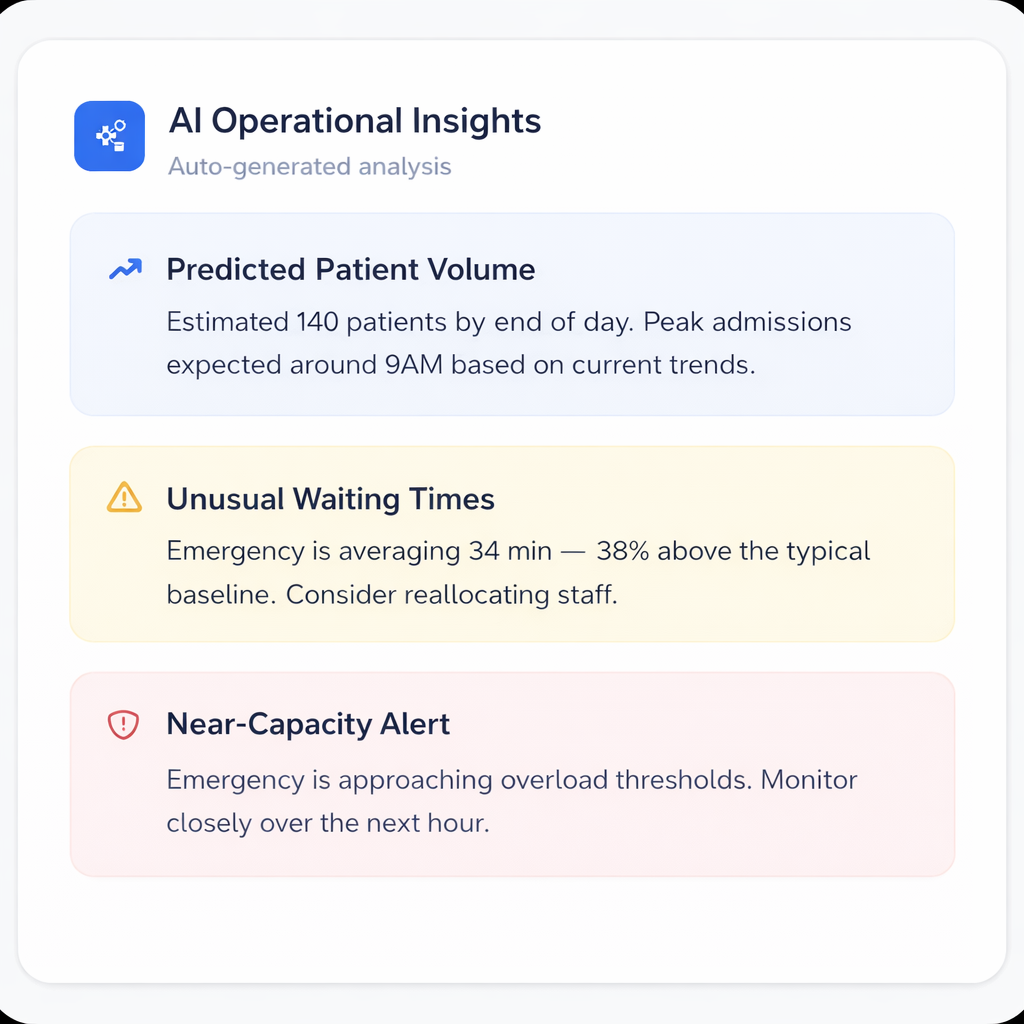
AI Operational Insights
An AI-powered insights panel highlights potential operational issues such as unusual increases in waiting times, department overload, and predicted patient volume. These insights help administrators detect critical situations earlier and take action more quickly.
Capabilities:
- Unusual waiting time detection
- Department overload alerts
- Predicted patient volume forecasting
- Priority-based alert system
Dashboard in Action
Animated preview of the dashboard interface showing real-time patient flow monitoring and AI-powered operational alerts.
Real-time dashboard interface with live data updates and AI-powered insights
AI-Assisted Design Process
To explore the dashboard concept quickly, AI-assisted prototyping tools were used to generate initial interface layouts.
Rapid Iteration
Prompt-based design enabled rapid iteration of different dashboard structures while focusing on the most relevant operational metrics.
Interface Layouts
AI tools were used to generate initial interface layouts, enabling fast exploration of visual structures and information hierarchies.
UX-Led Decisions
The UX decisions, information hierarchy and AI insights integration were defined as part of the design process to support faster operational decision-making.
Transforming Data into Action
The proposed dashboard demonstrates how AI-assisted insights can transform operational data into actionable information.
Real-Time Monitoring
Combining real-time monitoring with intelligent alerts enables administrators to stay informed about critical operational changes as they happen.
Faster Decision-Making
The interface supports faster decision-making by presenting complex operational data in a clear, actionable format.
Improved Resource Management
Better visibility into department capacity and staff availability enables more efficient resource allocation across the hospital.
Hospital Environment Support
The dashboard is specifically designed to support the unique operational challenges of hospital environments.
Balancing Information Density with Clarity
Designing dashboards for complex environments such as healthcare requires balancing information density with clarity.
Key Learning
This project explores how AI-assisted insights can help reduce cognitive load and make critical operational information easier to understand. By surfacing the most relevant patterns and anomalies automatically, the dashboard allows administrators to focus on decision-making rather than data analysis.
Reducing Cognitive Load
AI insights help administrators quickly identify what matters most without manually analyzing multiple data streams.
Clearer Understanding
Visual hierarchy and real-time indicators make complex operational data more accessible and actionable.